Decoding Performance Patterns That Separate Consistent Standouts From One-Season Flashes Across Football, Basketball, and Hockey Circuits
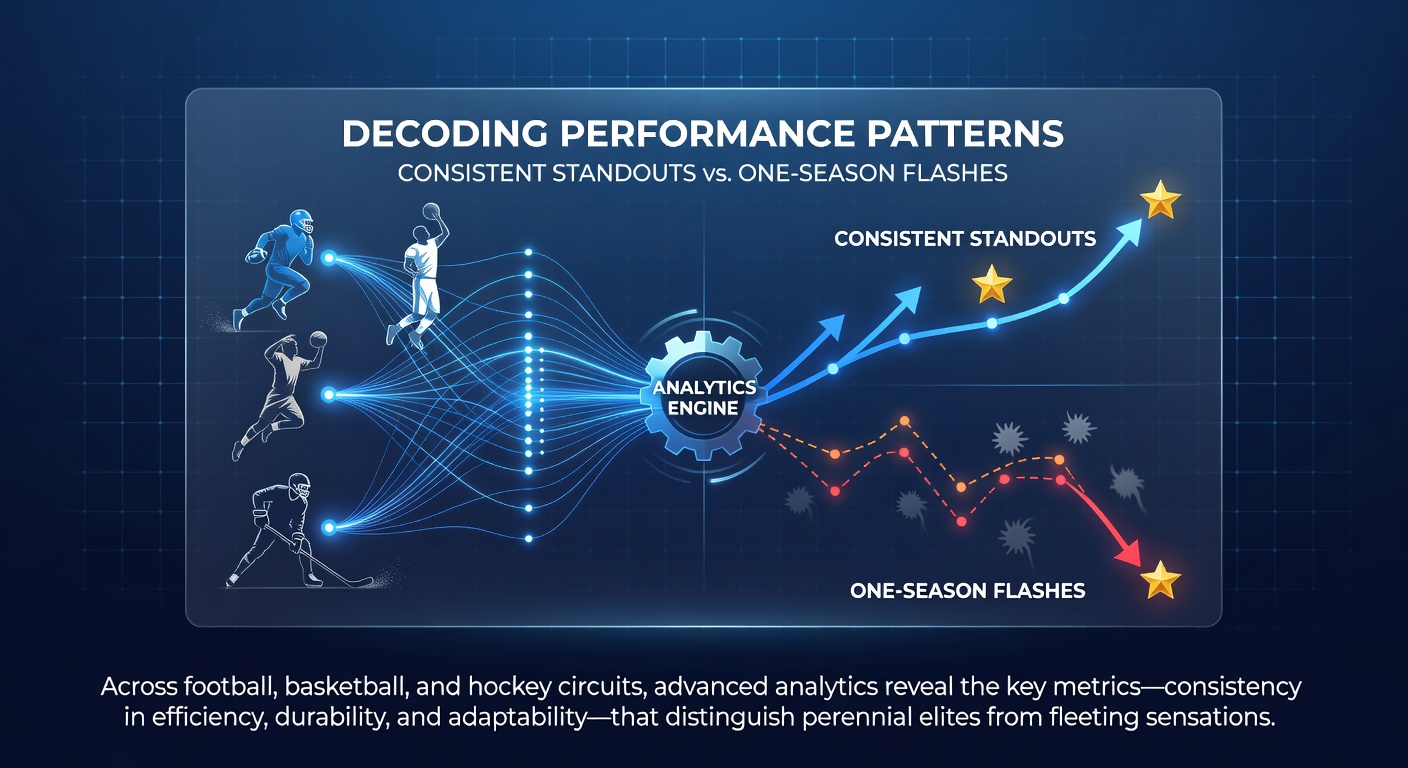
Performance data across professional leagues continues to highlight clear distinctions between athletes who sustain high output over multiple seasons and those whose peaks remain isolated to single campaigns. Researchers tracking metrics in the NFL, NBA, and NHL have documented these differences through longitudinal studies that examine statistical variance, workload management, and adaptive adjustments rather than isolated scoring bursts.
Core Statistical Indicators of Sustained Output
Analysts examine year-over-year stability in key indicators such as efficiency ratings, usage rates, and advanced composite scores to separate durable contributors from short-term standouts. In football circuits, for instance, metrics like Pro Football Focus grades and expected points added per play show tighter clustering among repeat performers who maintain elite levels across five or more seasons compared with players whose numbers spike once before regressing sharply toward league averages.
Basketball data reveals similar patterns when tracking true shooting percentage alongside assist-to-turnover ratios and defensive box-plus-minus figures. Those who deliver consistent seasons often display minimal fluctuation in these areas even as team roles evolve, whereas one-season flashes frequently pair high scoring volume with elevated variability in shooting efficiency from one month to the next.
Hockey organizations rely on Corsi percentages, expected goals, and time-on-ice reliability to identify players whose contributions remain steady regardless of linemate changes. Figures from league tracking systems indicate that consistent NHL standouts post lower standard deviations in these categories over rolling three-year windows.
Durability and Recovery Patterns
Long-term availability forms another separating factor. Medical and performance staffs across the three sports track injury incidence alongside recovery timelines, noting that athletes who avoid extended absences demonstrate repeatable access to peak conditioning windows. Data compiled through the 2025-26 campaigns shows players with fewer than twenty missed games per five-season span maintain higher cumulative production totals than peers who experience repeated soft-tissue or concussion setbacks.
What's interesting is how training load monitoring has refined these insights. Teams now integrate GPS and heart-rate variability readings to adjust practice intensities, and athletes who adhere to individualized thresholds record fewer breakdowns that derail multi-year trajectories.
Adaptability Across Roles and Systems
Consistent performers also demonstrate quicker integration into new schemes or lineups. In basketball, observers note players who sustain production after mid-season trades or coaching changes often post comparable per-minute efficiencies in both starting and bench capacities. Football wide receivers and defensive backs who maintain target shares or coverage grades under multiple offensive coordinators illustrate the same trait.
Hockey forwards and defensemen who transition between power-play, penalty-kill, and even-strength units without measurable drops in expected goal differentials further exemplify this flexibility. League reports from May 2026 highlight several players whose statistical profiles remained stable despite significant roster turnover following the previous trade deadline.
Case Examples From Recent Seasons
Take one quarterback whose completion percentage above expected stayed within a narrow band across four consecutive years despite changes in offensive line personnel. Contrast that trajectory with a receiver whose yardage totals exploded in a single contract year before returning to median output once supporting cast adjustments occurred. Similar contrasts appear in basketball when comparing forwards whose rebounding and defensive metrics hold steady through varying frontcourt alignments against scorers whose efficiency collapses outside specific spacing systems.
Hockey supplies parallel illustrations. Centers whose face-off win rates and zone-entry contributions remain elevated through multiple coaching staffs stand apart from wingers whose point totals surge once before plateauing when deployed in different line combinations. Research from institutions including the University of Waterloo has examined these patterns in NHL datasets, linking sustained role versatility to lower performance variance.
Emerging Analytical Tools
Front offices increasingly combine traditional box-score data with machine-learning models that weight recent performance against historical baselines. These approaches flag athletes whose underlying skill indicators diverge from surface-level results, allowing teams to project longer arcs rather than chase single-season outliers. As of May 2026, several organizations have published internal findings showing improved draft and free-agent retention rates when such models receive heavier emphasis.
But here's the thing: external factors such as schedule strength and rule modifications also influence outcomes, so analysts cross-reference multiple seasons before drawing conclusions about any individual trajectory.
Conclusion
Across football, basketball, and hockey, the separation between sustained excellence and fleeting peaks rests on measurable patterns in statistical stability, physical availability, and tactical adaptability. Data compiled through recent campaigns continues to refine these distinctions, offering clearer frameworks for talent evaluation at both the professional and developmental levels.