How Statistical Forecasting Tools Are Reshaping Annual Player and Team Evaluation Frameworks in Professional Leagues
Written by Erik Lange · Jul 26, 2026
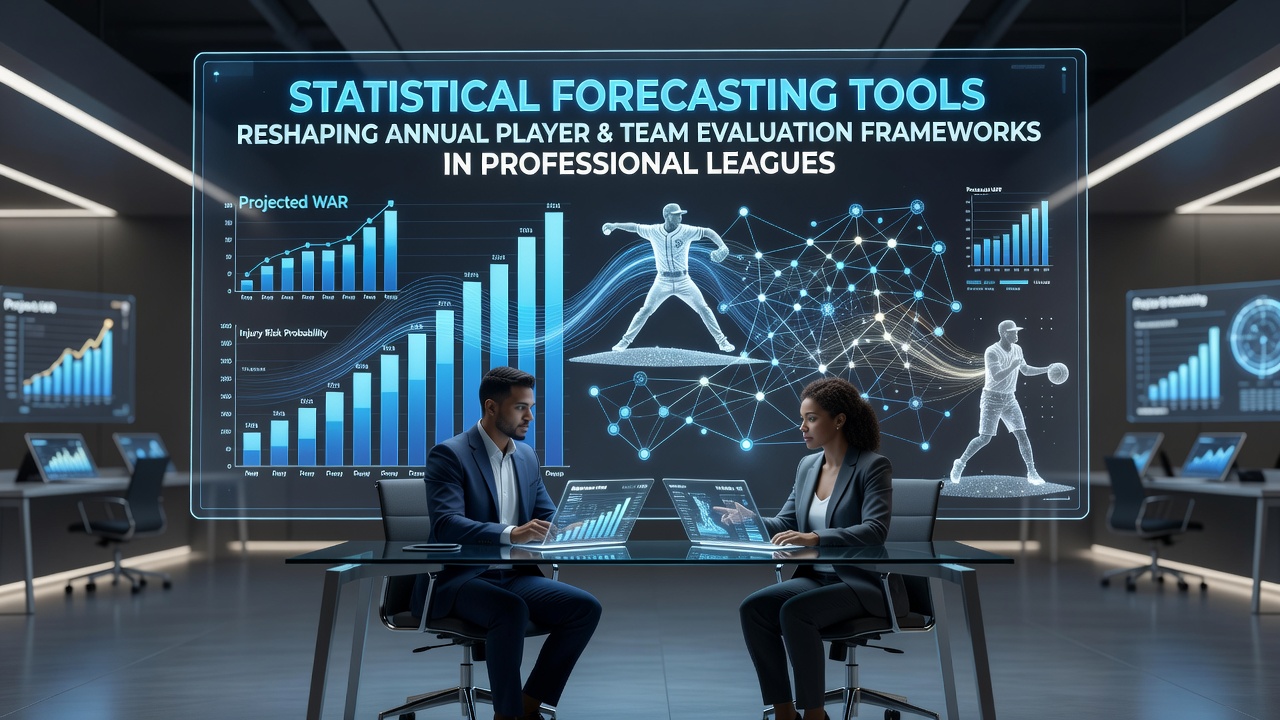
How Statistical Forecasting Tools Are Reshaping Annual Player and Team Evaluation Frameworks in Professional Leagues
Statistical forecasting tools now drive annual evaluations across major professional leagues, shifting focus from traditional scouting reports to data-driven projections that integrate historical performance, injury patterns, and opponent adjustments. Leagues such as Major League Baseball, the National Basketball Association, and the English Premier League have adopted these systems to refine contract decisions and roster construction each offseason.
Expansion of Predictive Models in League Operations
Teams began integrating advanced forecasting platforms in the early 2010s, and by July 2026 several organizations released updated versions that incorporate real-time biometric feeds alongside box-score data. These platforms generate probability distributions for player output rather than single-point estimates, allowing front offices to model scenarios across an entire season. Data from multiple leagues shows that clubs using such systems have altered their draft strategies, prioritizing metrics like expected goals above replacement in soccer and adjusted plus-minus variants in basketball.
Researchers at academic institutions have documented how these tools aggregate variables including workload management and travel schedules to produce seasonal outlooks. One study from a Canadian university sports analytics group linked reduced injury rates in hockey to models that flag high-risk workload spikes weeks in advance. Front offices now review these outputs during annual reviews, replacing earlier reliance on subjective scouting grades with layered probability assessments.
Player Evaluation Frameworks Undergo Structural Changes
Annual player assessments now combine traditional statistics with forward-looking simulations that account for age curves and positional shifts. In baseball, systems like those maintained by the Society for American Baseball Research provide updated projections each July that feed directly into arbitration hearings and free-agent negotiations. Scouts still attend games, yet their qualitative notes are cross-referenced against model outputs that quantify defensive range and pitch-tunnel effectiveness.
Basketball operations departments apply similar frameworks when ranking restricted free agents. Forecasting engines calculate expected value over the life of a contract by blending usage rates, spacing metrics, and regression-to-the-mean adjustments. Teams in the National Basketball Association have adjusted their internal rankings after models highlighted discrepancies between raw scoring totals and sustainable efficiency markers.

Team-Level Planning and Roster Architecture
Franchises apply forecasting suites to simulate entire roster constructions before the annual trade deadline or draft. These simulations test multiple trade combinations and free-agent signings against projected salary-cap constraints and performance distributions. European soccer clubs have used comparable systems to model squad depth across domestic and continental competitions, adjusting for fixture congestion that occurs in winter months.
League-wide data repositories now supply standardized inputs that enable cross-team comparisons. Organizations in the Australian Football League publish annual reports showing how forecasting accuracy improved after they standardized player-tracking data feeds. This standardization allows evaluators to compare prospects across different conferences or leagues without recalibrating every metric manually.
Integration of External Data Sources
Modern forecasting platforms pull from weather databases, travel logs, and even opponent scouting archives to refine projections. A report issued by an academic consortium based in Germany demonstrated measurable improvements in soccer match-outcome predictions once atmospheric and pitch-condition variables entered the models. Teams incorporate these layers during midseason reviews, recalibrating expectations for remaining games and future seasons.
Coaches and analysts receive dashboards that update nightly, highlighting deviations between projected and actual performance. When a player exceeds or falls short of forecasted benchmarks, evaluation committees convene to determine whether the variance signals a sustainable change or random fluctuation. This process has shortened the timeline between observation and roster adjustment in several circuits.
Conclusion
Statistical forecasting tools have become embedded in the annual cycle of player and team evaluations across professional leagues. Their outputs shape contract structures, draft selections, and in-season tactics by supplying quantified ranges rather than deterministic rankings. As data collection expands and computational methods advance, these frameworks continue to influence how organizations allocate resources each year.