Mapping Sponsorship Allocations That Quietly Recalibrate Resource Access and Performance Hierarchies Across Global Team and Individual Sports Circuits
Written by Mia Long · Jun 28, 2026

Mapping Sponsorship Allocations That Quietly Recalibrate Resource Access and Performance Hierarchies Across Global Team and Individual Sports Circuits
Observers note that sponsorship allocations follow identifiable patterns where major brands direct the bulk of their budgets toward established entities in soccer, basketball, tennis, and cycling circuits, and these decisions shape who gains access to advanced training facilities, specialized coaching staffs, and performance analytics tools. Researchers at institutions across Europe and North America have tracked how these flows create measurable differences in resource availability between top-tier and mid-level participants.
Allocation Patterns in Team Sports Leagues
League standings data from the 2024-2025 season onward reveal that clubs with prior championship success secure multi-year deals worth tens of millions from automotive and technology sponsors, while emerging teams receive shorter contracts focused on regional exposure rather than global campaigns. This distribution pattern means leading franchises in European soccer and North American basketball gain consistent upgrades to medical recovery centers and travel logistics, whereas lower-ranked squads operate with tighter budgets that limit roster depth. Analysts from the Australian Sports Commission have documented similar trends in rugby and cricket competitions where title sponsors prioritize clubs already positioned near the top of performance tables.
Figures released in early 2026 show that broadcast-linked sponsorship packages in basketball circuits further concentrate resources among franchises with large market footprints, and these packages often include provisions for exclusive equipment partnerships that smaller organizations cannot match. The result appears in positional statistics where teams benefiting from such allocations post higher average player durability rates during extended seasons.
Individual Athlete Circuits and Sponsorship Mapping
Individual sports such as tennis, golf, and track events display even more concentrated allocation maps because personal endorsement contracts hinge on current world rankings rather than collective team performance. Athletes who reach quarterfinal stages at major tournaments attract deals that fund private coaching teams and specialized recovery protocols, while those ranked outside the top fifty often rely on federation grants that cover only basic travel and equipment. Data compiled through 2025 indicates that players who secure primary sponsorships early in their careers maintain access to biomechanical analysis software and altitude simulation chambers at higher rates than their peers.
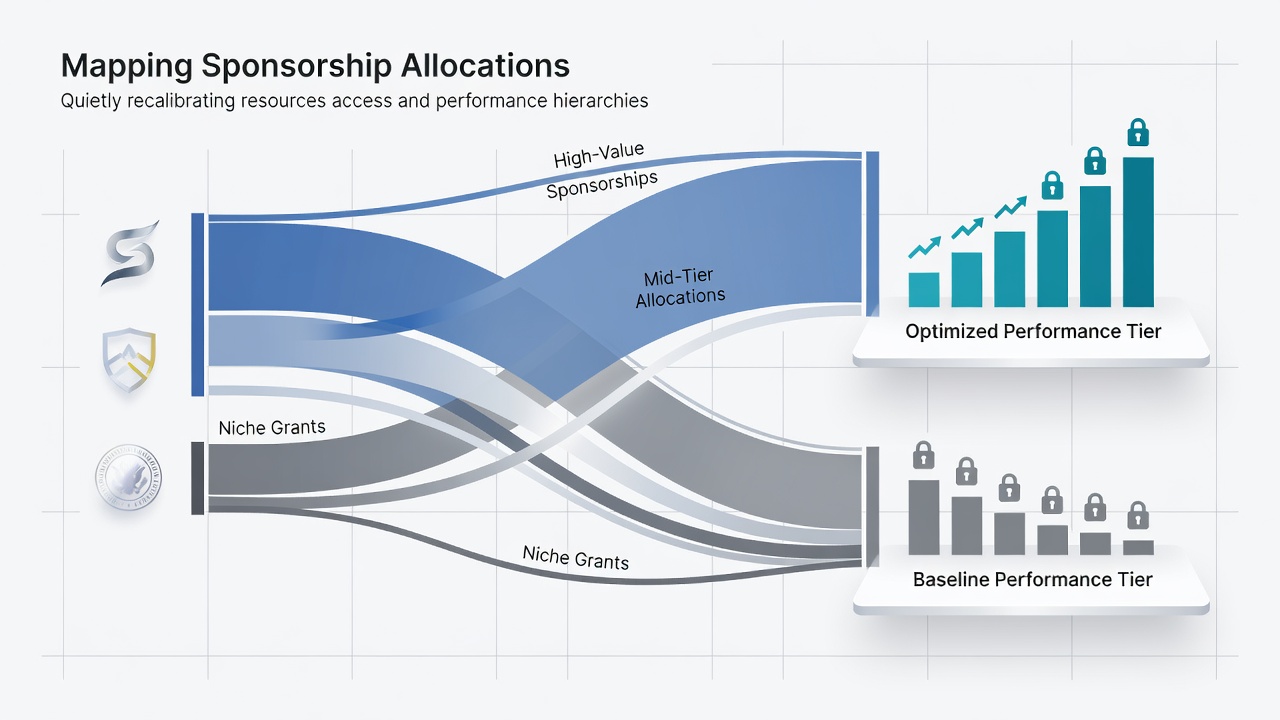
Studies conducted by academic groups in Canada and the United Kingdom demonstrate that these personal sponsorship maps create feedback loops where ranking improvements lead directly to increased funding, and that funding then supports further ranking gains through enhanced preparation cycles. In cycling road races, for instance, riders with equipment sponsor support record lower equipment failure rates during grand tours compared with those using standard federation-issued gear.
Resource Access and Resulting Performance Shifts
Performance hierarchies shift when sponsorship allocations determine who receives priority booking at high-performance centers and who obtains custom nutrition programs tailored by sports science teams. Across multiple circuits, teams and athletes with larger sponsorship portfolios post incremental gains in key metrics such as recovery time between matches and injury prevention scores. European Commission reports on sports economics note that these advantages compound over seasons because early resource edges allow sustained participation in high-level competitions.
June 2026 data releases from several international federations highlight how mid-season sponsorship renegotiations can alter training camp access for entire squads, and observers note corresponding changes in league position trajectories for clubs that secure new deals versus those that do not. The same patterns hold in individual events where prize money pools tied to sponsor visibility further widen gaps between consistent top finishers and occasional contenders.
Cross-Sport Comparisons and Emerging Trends
Comparative analysis across sports shows that team circuits experience slower recalibration of hierarchies because collective bargaining agreements sometimes distribute portions of sponsorship revenue more evenly, whereas individual circuits allow faster reallocation based on single-athlete results. Yet both domains exhibit the same core mechanism where mapped sponsorship dollars translate into measurable edges in facilities, personnel, and technology. Research papers from universities in Germany and Australia confirm that these edges appear most clearly in endurance-based events and racket sports where marginal gains in equipment quality or recovery protocols accumulate over long seasons.
Those who have examined allocation databases across decades point out that digital tracking tools now make these patterns more visible to analysts, and federations increasingly publish aggregated figures that reveal how certain regions attract disproportionate sponsorship attention. The resulting resource maps influence not only current standings but also talent development pipelines that feed future performance hierarchies.
Conclusion
Mapping exercises conducted by sports economists and governing bodies continue to illustrate how sponsorship allocations function as quiet recalibrators of access and outcomes across global circuits, and the patterns documented through 2026 confirm that resource distribution remains tightly linked to existing performance levels while simultaneously reinforcing those levels through enhanced preparation capabilities.