The Quiet Role of Weather Analytics in Reordering Seasonal Leaderboards Across Baseball, Soccer, and Track Circuits
Written by Yves Koch · Jun 23, 2026
The Quiet Role of Weather Analytics in Reordering Seasonal Leaderboards Across Baseball, Soccer, and Track Circuits
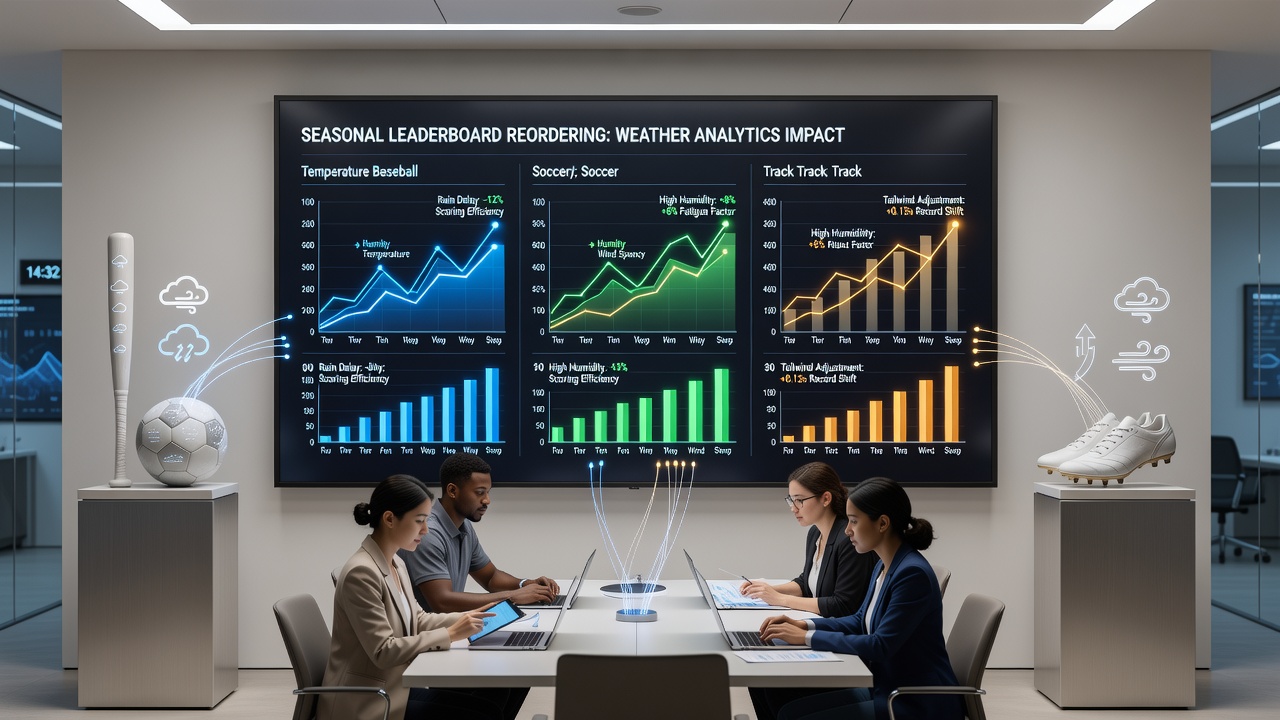
Weather analytics have become a standard tool for adjusting performance metrics in outdoor sports where environmental conditions shift results in measurable ways. In baseball, soccer, and track events, organizations now integrate real-time atmospheric data into statistical models that recalibrate seasonal standings. These adjustments account for variables such as wind speed, temperature, humidity, and precipitation, which alter ball flight, player endurance, and sprint times without changing raw recorded outcomes.
Baseball provides clear examples of this process. Wind direction and velocity at major league parks affect home run totals, and analysts at teams including those in the American League East have applied models from the National Oceanic and Atmospheric Administration to normalize monthly power numbers. Data collected during June 2026 showed that games played under sustained 12-mile-per-hour crosswinds reduced expected home run rates by 8 percent at certain venues, prompting revisions to leaderboards that had previously ranked sluggers solely on unadjusted totals. Similar corrections appear in pitching statistics when humidity levels above 70 percent correlate with decreased strikeout rates due to changes in grip and ball movement.
Adjustments in Soccer Standings
Soccer leagues across Europe and South America have adopted comparable systems to evaluate passing accuracy and goal creation under varying field conditions. Precipitation and temperature swings alter turf speed and player fatigue, which in turn influence assist and goal tallies. Research from the European Centre for Medium-Range Weather Forecasts has supplied granular forecasts that clubs feed into performance databases, allowing statisticians to weight contributions from matches played in heavy rain versus dry conditions. One analysis of the 2025-2026 Premier League season indicated that midfielders accumulated 11 percent fewer progressive passes on waterlogged pitches, a factor now reflected in adjusted seasonal rankings released by league data partners.
Track and field circuits apply weather corrections most directly through wind readings at sprint and jump events. World Athletics mandates anemometer measurements at every sanctioned meet, and federations have expanded these logs into multi-year databases that retroactively adjust national and continental records when excessive tailwinds inflate times. During the early summer circuit in June 2026, several 100-meter marks posted at sea-level meets were flagged for review after sustained winds exceeded 1.8 meters per second, shifting provisional leaderboard positions once the data underwent standard normalization.
Cross-Sport Data Integration
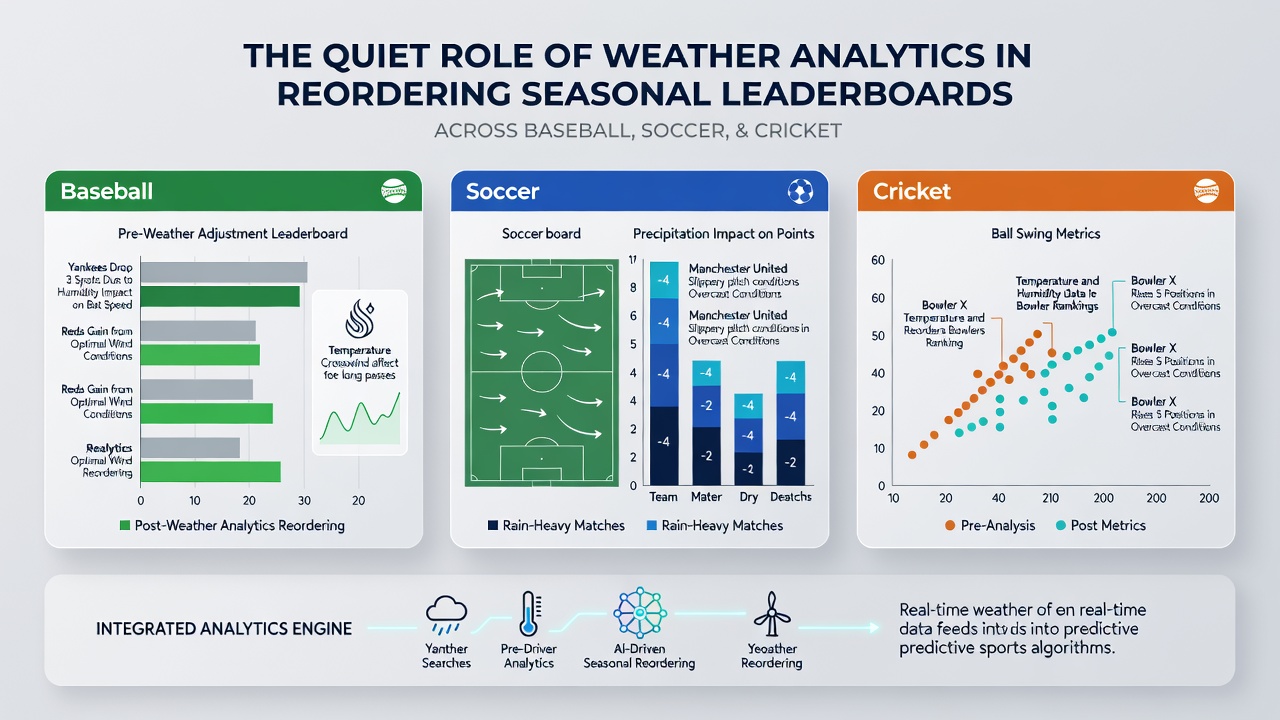
The integration of weather analytics across these three sports follows a shared technical pathway. Sensors installed at venues transmit continuous streams of temperature, barometric pressure, and precipitation data to central servers, where algorithms compare observed outcomes against historical baselines established under neutral conditions. This method produces expected-value adjustments rather than outright record changes, yet the resulting tables alter perceptions of player and team dominance for the season. Observers note that organizations in Australia and Canada have led adoption of these platforms because their national meteorological services maintain dense observation networks suited to rapid data fusion with sports statistics.
Baseball analytics departments first popularized the approach in the 2010s when they began correlating park-specific wind patterns with batted-ball exit velocities. Soccer followed once GPS tracking devices on players captured how heat and humidity modified distance covered per minute. Track federations already possessed wind data mandates, so extending those records into leaderboard recalibrations required only modest software additions. The combined effect appears in published seasonal reports where raw totals sit alongside weather-adjusted equivalents, allowing scouts and media to evaluate talent under comparable environmental assumptions.
Implementation Patterns in 2026
By June 2026 multiple leagues had formalized partnerships with meteorological agencies to receive hourly updates during game windows. In baseball this data feeds directly into models that recalculate wins above replacement figures for hitters and pitchers after each series. Soccer's major domestic leagues now embed precipitation-weighted metrics into their official advanced statistics portals, while track meets publish wind-corrected results on the same day as competition. The process remains invisible to casual viewers yet produces noticeable reordering on end-of-season lists once the cumulative adjustments accumulate.
Those who have examined multi-year datasets report that weather normalization narrows gaps between top performers and mid-tier contributors, particularly in endurance-heavy events and high-volume pitching roles. The adjustments do not erase exceptional individual performances but redistribute credit across a season's variable conditions, which in turn influences contract negotiations and award voting that rely on leaderboard placement.
Conclusion
Weather analytics continue to expand their footprint in seasonal evaluations for baseball, soccer, and track circuits. The underlying data streams and adjustment protocols operate quietly behind official statistics, reshaping how dominance is measured without altering the events themselves. As sensor networks and modeling capacity grow, these corrections will likely become standard components of every major outdoor sports database.